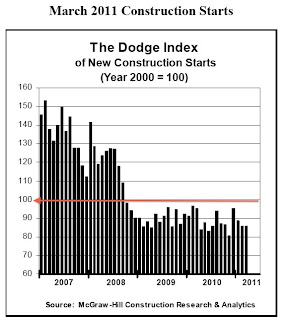
But look more closely at the vertical axis of the graph. These numbers do not reflect the absolute number of starts. Instead, they are an index, where the number of starts in 2000 is equal to 100%. From this perspective, the economy is only down about 10 percent since a decade ago. Not too bad considering that we have fought two wars abroad, one at home, and had a massive screw-up in the banking system.
The rate of starts has been steady for the past three years. There are a lot of advantages to a steady economy, and companies that innovate can still grow in market share. The trouble is, that economies seldom stay steady for long.
Here is McGraw-Hill's most recent market summary:
February Construction Slips 4 Percent
New York, N.Y. – March 16, 2011 – At a seasonally adjusted annual rate of $404.9 billion, new construction starts in February fell 4% from the previous month, it was reported by McGraw-Hill Construction, a division of The McGraw-Hill Companies. Nonresidential building lost momentum for the second month in a row, and the public works sector retreated after its elevated pace in January. Meanwhile, residential building in February was able to register modest growth. For the first two months of 2011, total construction on an unadjusted basis was $55.9 billion, down 9% from a year ago.
The February statistics lowered the Dodge Index to 86 (2000=100), compared to readings of 90 in January and 95 in December. For over a year, the Dodge Index has hovered between 80 and 96, with the average for all of 2010 coming in at 88. “The pace of construction starts continues to fluctuate within a set range, as the gains for one month are taken back by weaker activity in subsequent months,” stated Robert A. Murray, vice president of economic affairs for McGraw-Hill Construction. “Compared to the declines witnessed from 2007 through 2009, the overall volume of activity has steadied in a broad sense, but this period of low-level stability is turning out to be extended. Given various countervailing factors in the environment, this fluctuation within a set range is likely to continue a while longer. On the plus side, job growth seems to be picking up, vacancy rates are beginning to recede, and interest rates remain low. At the same time, financing for construction projects from the banking sector has shown only modest improvement. And, the tough fiscal climate being faced by federal, state, and local governments has added further constraints to public construction programs.”
Nonresidential building in February dropped 5% to $132.3 billion (annual rate), retreating for the second straight month after December’s heightened activity. For the commercial categories, office construction in February fell 30% from the prior month, which had been lifted by groundbreaking for four office projects valued each in excess of $100 million. The office category in February did include the start of one project valued in excess of $100 million – the $125 million modernization of the General Services Administration headquarters building in Washington DC. Hotel construction also reported a substantial February decline, falling 37% after the prior month had been boosted by the start of a large convention-center hotel in Washington DC. Warehouse construction stayed weak in February, sliding an additional 13%, while store construction edged up 1%. The manufacturing plant category in February climbed 54%, aided by the start of a $500 million cellulose ethanol plant in Kansas.
For the institutional categories, healthcare facilities dropped 27% in February, continuing to settle back after the brisk pace of contracting reported at the end of last year. Whereas December featured the start of six large hospital projects valued in excess of $100 million, and January had two such projects, the largest healthcare project in February was the $73 million clinic portion of the $360 million Cleveland Medical Mart and Convention Center in Cleveland OH. The educational buildings category decreased 12% in February, reflecting the downward pull arising from tight state and local budgets. Providing some support in February were the start of two large high schools, located in Virginia ($66 million) and Pennsylvania ($60 million), as well as groundbreaking for a $55 million medical research facility in Texas. The smaller institutional categories were able to register gains in February. The transportation terminal category jumped 310% after a depressed January, helped by the start of a $200 million bus depot in New York NY and a $143 million transit hub renovation in St. Paul MN. Amusement-related work climbed 92% in February, led by the $287 million convention center portion of the Cleveland Medical Mart and Convention Center. Moderate January gains were posted by public buildings, up 9%; and religious buildings, up 5%; relative to weak activity in January.
Nonbuilding construction, at $151.5 billion (annual rate), slipped 9% in February. Highway and bridge construction dropped 27% from January’s exceptional amount, which included the start of a $1.5 billion project to add new lanes to the LBJ Freeway in Dallas TX. The February pace for highway and bridge construction remained a slight 1% above the monthly average for 2010, as the waning support from the federal stimulus act is only just beginning to have a dampening impact. Decreased activity in February was also shown by river/harbor development, down 52%; site work and mass transit, down 34%; and sewer construction, down 13%; following the gains each category reported in January. Water supply construction was the one public works category able to show improvement in February, rising 51%, with the boost coming from the start of several water treatment plant projects located in Washington state ($51 million), Oklahoma ($47 million), and New York ($45 million). The electric utilities category had a strong February, surging 46%, as the brisk activity witnessed during 2010 for this project type has yet to slow down. Large electric utility projects that were reported as construction starts in February included a $2.4 billion coal-gasification power plant in Mississippi and a $1.4 billion wind farm in Oregon.
Residential building in February moved up 2% to $121.1 billion (annual rate). The strength came from the multifamily side of the housing market, which advanced 67% in February after a brief loss of momentum during January. Large projects that were reported as February starts included a $140 million apartment building in Secaucus NJ, an $87 million apartment building in Chicago IL, and a $58 million apartment building rehabilitation in Minneapolis MN. Murray noted, “Multifamily housing is turning out to be one of the few near-term bright spots for the construction industry. While rising from a very low amount, multifamily housing in 2010 grew 12% in dollar terms, faster than the 6% gain reported for single family housing, and it’s expected to see another double-digit increase in 2011.” Single family housing in February slipped back 7%, as the modest improvement that seemed to re-emerge towards the end of 2010 paused. The single family slowdown in February was widespread by geography, with all five regions showing reduced activity – the Midwest, down 2%; the South Atlantic, down 4%; the South Central, down 7%; the West, down 8%; and the Northeast, down 21%.
The 9% decline registered by total construction on an unadjusted basis for the first two months of 2011, compared to 2010, was the result of a mixed performance by major sector. Nonresidential building was down 21%, reflecting this pattern by segment – commercial building, up 6%; manufacturing building, up 483%; and institutional building down 37%. Last year’s nonresidential total included the start of two massive projects during the January-February period – the $3.0 billion transit hub in lower Manhattan NY and the $1.1 billion airport terminal project at Los Angeles International Airport. If these two large institutional projects are excluded from the 2010 statistics, then the year-to-date change for 2011 would be the following – institutional building, down 18%; nonresidential building, down 5%; and total construction, down 2%. Nonbuilding construction during the January-February period of 2011 was up 9%, helped by this year’s early strength for electric utilities, while residential building retreated 14% year-todate. By geography, total construction during the first two months of 2011 performed as follows – the Northeast, down 34%; the South Atlantic, down 30%; the Midwest, down 6%; the West, up 5%; and the South Central, up 17%.
Useful perspective is obtained by looking at twelve-month moving totals, in this case the twelve months ending February 2011 compared to the twelve months ending February 2010. On this basis, total construction is down 3%, due to this pattern by sector – nonresidential building, down 10%; nonbuilding construction, no change; and residential building, up 1%. By region, the twelve months ending February 2011 showed this behavior for total construction – the South Atlantic, down 16%; the Northeast, down 6%; the Midwest down 1%, the South Central, up 1%; and the West, up 4%.